
Computer crashes are frustrating. They can happen even if you're doing everything right. So understanding how to properly diagnose the underlying cause of a PC crash is a seriously useful skill.
The key to successfully dealing with a computer crash is identifying the root cause. It's like a doctor dealing with a patient suffering from headaches and congestion. The doctor could prescribe painkillers to try and ease the painful headaches and maybe a decongestant—sure, that would be a little helpful—but imagine if this doctor discovered that the patient had a sinus infection, and that this sinus infection was almost certainly responsible for their headaches and congestion. Surely, it would be much better to cure the sinus infection than to treat the headaches and congestion, right?
It's the same principle with computers: don't just treat the symptoms; find the cause. Fortunately for us, the cause of many computer crashes can be narrowed down by following a few simple flows.
Now, on rare occasions, there is a PC crash that is truly a one-off and, after a simple restart, requires no further action. Personally, I investigate all PC crashes immediately; however, I'm a nerd. So I would say that if your PC crashes, you're fine to hold off on the diagnostics until it has happened a second time. That's not the official guidance, but I believe it's the most practical. You don't want to waste an hour of your time chasing down a crash that you'll never deal with again, right?
Once it happens a second time, though, we have a pattern. At that point, stop guessing and start collecting evidence.
First, what do you mean by "crash"?
Before opening any diagnostic tool, get specific about what the computer actually did. People use "crash" to describe several completely different problems:
- A BSOD or stop-code crash: Windows shows a blue or black error screen, gives you a stop code, and restarts. It is still commonly called a Blue Screen of Death or BSOD, even though newer versions of Windows 11 may display the stop screen with a black background.
- An instant shutdown or restart: The entire computer suddenly loses power or reboots, usually without showing a stop code.
- A complete freeze: The screen remains visible, but the mouse, keyboard, programs, and Windows itself stop responding.
- An application crash: One program closes, freezes, or reports "Not Responding," but the rest of Windows keeps working.
That last one matters. If Microsoft Word closes but the rest of your computer is fine, your PC did not crash. Word crashed. You should still investigate it, but it sends you down a different diagnostic path.
Before changing anything, write down what happened
Your first job is to preserve the evidence. Record:
- The exact date and time.
- What you were doing when it happened.
- Whether the PC froze, shut off, restarted, or showed a stop code.
- The exact stop code, if there was one.
- Any new hardware, software, drivers, Windows updates, or settings changed recently.
- Whether it happens during a specific activity, such as gaming, waking from sleep, starting a video call, or sitting idle.
Take a picture of the stop screen if you can. The error may disappear
quickly, and "it said something about memory" is not nearly as helpful as
MEMORY_MANAGEMENT with the exact code.
Do not start uninstalling programs, updating ten drivers, and running every repair command you have ever seen. Every change muddies the water. Diagnose first. Make one targeted change later, then see whether it worked.
Step 1 — Use Event Viewer to identify the type of shutdown
Event Viewer is a built-in Windows utility that records an enormous amount of system and application activity. It will not magically hand you the cause of every crash, but it can tell you whether Windows shut down cleanly, suffered a bug check, or simply discovered on the next boot that something had gone very wrong.
Open Event Viewer
- Press Windows key + R.
- Type
eventvwr.msc. - Press Enter.
- In the left panel, expand Windows Logs and select System.
Before doing anything else, scroll to the exact time of the crash. Timing matters more than the fact that an event is red.
Filter the useful shutdown and crash events
In the right panel, select Filter Current Log. In the Event IDs box, enter:
41, 1001, 1074, 6005, 6006, 6008Do not filter only for Critical and Error events. Some of the most useful shutdown records are logged as Information.
Event IDs are not globally unique, either. The event's Source matters just as much as its number.
| Event ID | Usual source | What it actually tells you |
|---|---|---|
| 41 | Kernel-Power | Windows started and determined that the previous shutdown was not clean. |
| 1001 | Windows Error Reporting (WER)-SystemErrorReporting / BugCheck | Windows rebooted from a bug check and may list the stop code and crash-dump path. |
| 1074 | User32 | A user or process intentionally requested a shutdown or restart. |
| 6005 | EventLog | The Windows Event Log service started. This is a useful boot marker. |
| 6006 | EventLog | The Event Log service stopped normally, which generally indicates a clean shutdown. |
| 6008 | EventLog | Windows reports that the previous shutdown was unexpected. |
Kernel-Power 41 does not tell you the cause
Event ID 41 is probably the most misunderstood entry in all of Event Viewer. It does not mean that your power supply is bad. It does not even prove that the original failure was power-related.
It means Windows rebooted without completing a normal shutdown. That could happen because:
- The power went out.
- The power supply or charger failed.
- The PC overheated and shut itself down.
- Windows hit a BSOD and restarted.
- The system froze and you held down the power button.
- Someone pressed the reset button.
Kernel-Power 41 is evidence of the aftermath. It is not the root cause.
"By itself, Event ID 41 might not contain sufficient information to explicitly define what occurred." — Microsoft's Event ID 41 documentation
Read the sequence, not one isolated event
Here are the common patterns:
- 1074 → 6006 → 6005: A user, Windows Update, or another process requested a planned restart. Open Event 1074 and read the process name, user, shutdown type, and reason.
- 1001 + 41 + 6008: Windows suffered a bug check and then recorded the dirty shutdown after restarting. Event 1001 is the useful one because it may contain the stop code and dump-file location.
- 41 + 6008, with no 1001 and no dump: The computer lost power, was forcibly reset, completely froze, or failed before Windows could write a crash dump. This narrows the field, but it still does not prove which one occurred.
- No system-shutdown events at all: You may be dealing with an application crash instead of a Windows crash. Check Windows Logs → Application and Reliability Monitor.
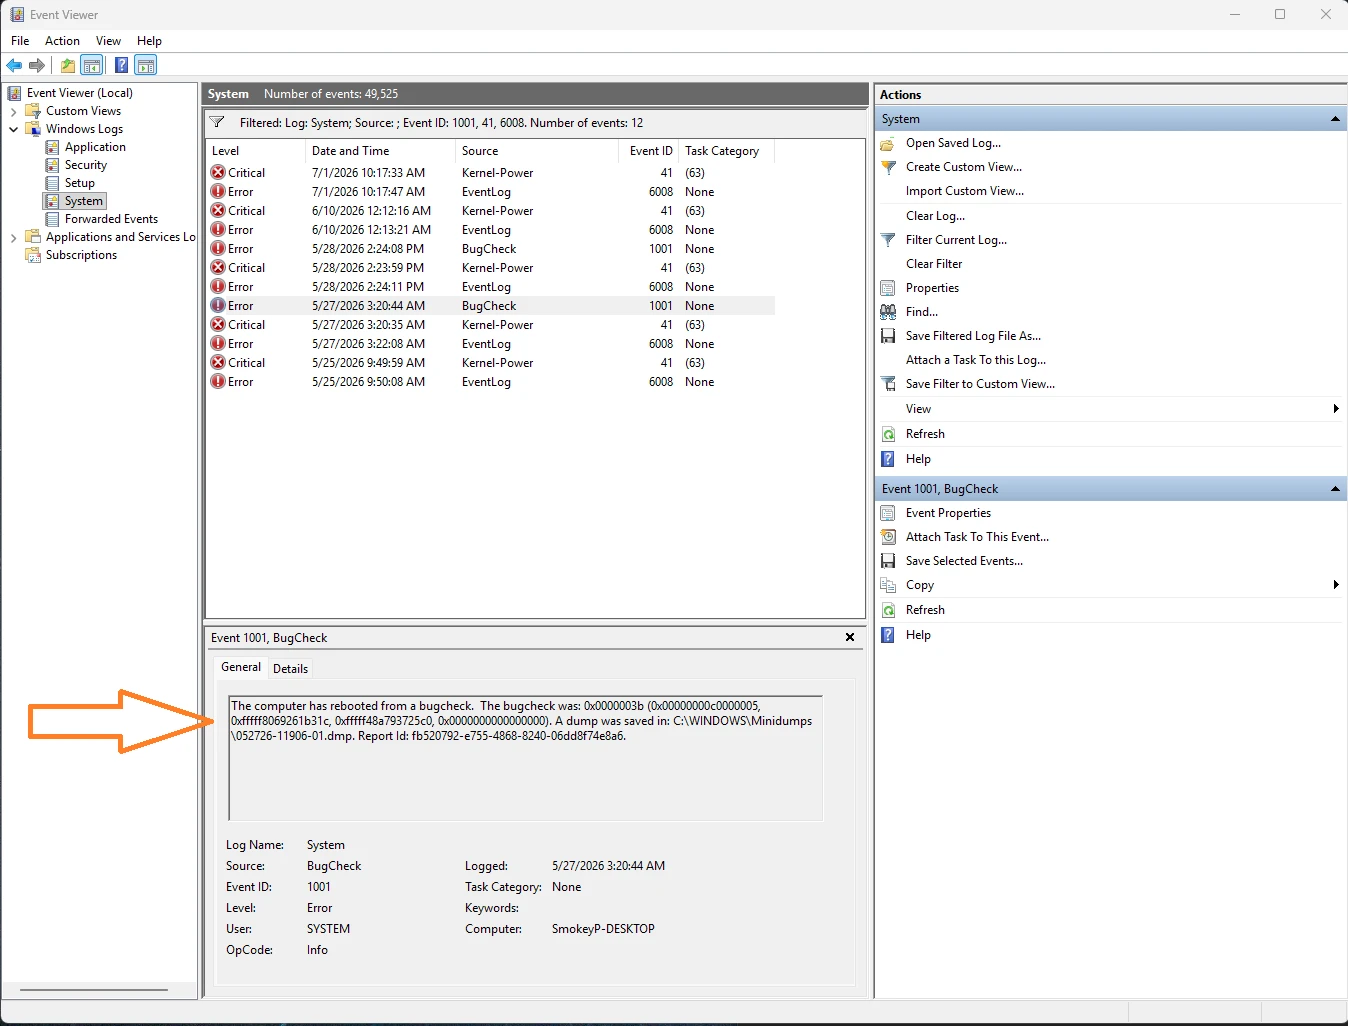
Now clear the filter and inspect the minute or two before the failure. Look for clusters from sources such as:
- Windows Hardware Error Architecture (WHEA)-Logger, which records hardware error reports.
- Display, graphics-driver, or graphics processing unit (GPU)-related sources.
- Disk, Ntfs, stornvme, or storage-controller sources.
- A driver or service that failed repeatedly just before the crash.
Do not panic because you see unrelated warnings. Windows logs errors all day long on perfectly usable computers. A Domain Name System (DNS) warning from three hours earlier is not relevant to a midnight shutdown. You are looking for events that match the time, symptoms, and repeated pattern of your crash.
Step 2 — Use Reliability Monitor to build the timeline
Event Viewer is detailed but noisy. Reliability Monitor shows much of the same history on a far simpler timeline.
Press Windows key + R, enter:
perfmon /relThen:
- Find the date and time of the crash.
- Select the red X or warning marker.
- Open View technical details.
- Record the problem-event name, stop code, faulting application or module, and any dump-file location shown.
- Look at what changed shortly before the crashes began: a driver installation, Windows update, new application, or failed update.
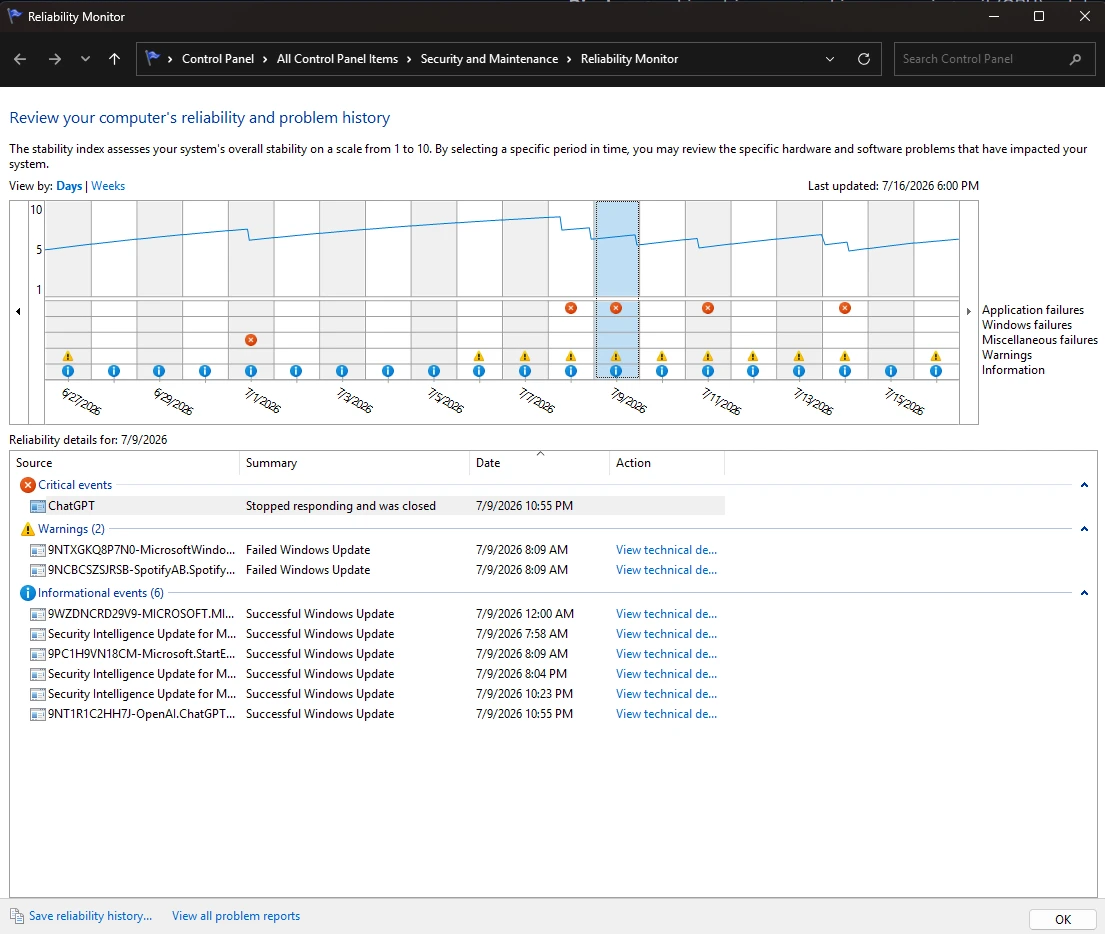
Reliability Monitor may show entries such as:
- Windows was not properly shut down
- Windows stopped working
- BlueScreen
- LiveKernelEvent
- Application stopped working
- Hardware error
The timeline is the real value here. If the machine was stable for six months, a graphics driver was installed on Tuesday, and the crashes started Tuesday night, that is useful evidence. It is not yet proof, but now you have a sensible suspect.
Also, "Windows was not properly shut down" is basically Reliability Monitor's version of Event 41. It confirms the dirty shutdown; it does not explain it.
Step 3 — If Windows produced a BSOD, read the crash dump
A BSOD is also called a bug check or
stop-code error. When Windows can do so, it writes a
snapshot of the crash to a .dmp file. That file contains far
more useful evidence than the blue screen itself.
Check:
C:\Windows\MinidumpYou may also have a larger dump at:
C:\Windows\MEMORY.DMPIf Windows blocks access to a minidump, copy the file to your Desktop and open the copy. Leave the original alone.
Install WinDbg
WinDbg—short for Windows Debugger—is Microsoft's free debugging tool. It is not installed by default, but you can get it through the Microsoft Store or run this command in PowerShell or Command Prompt:
winget install Microsoft.WinDbg
Open WinDbg, select File → Open dump file, and choose the
newest relevant .dmp file.
Once the dump loads, enter:
.symfix
.reload
!analyze -v
The first two commands configure and reload Microsoft's debugging symbols. Symbols turn raw memory addresses into readable module and function names. The last command runs WinDbg's verbose automated crash analysis.
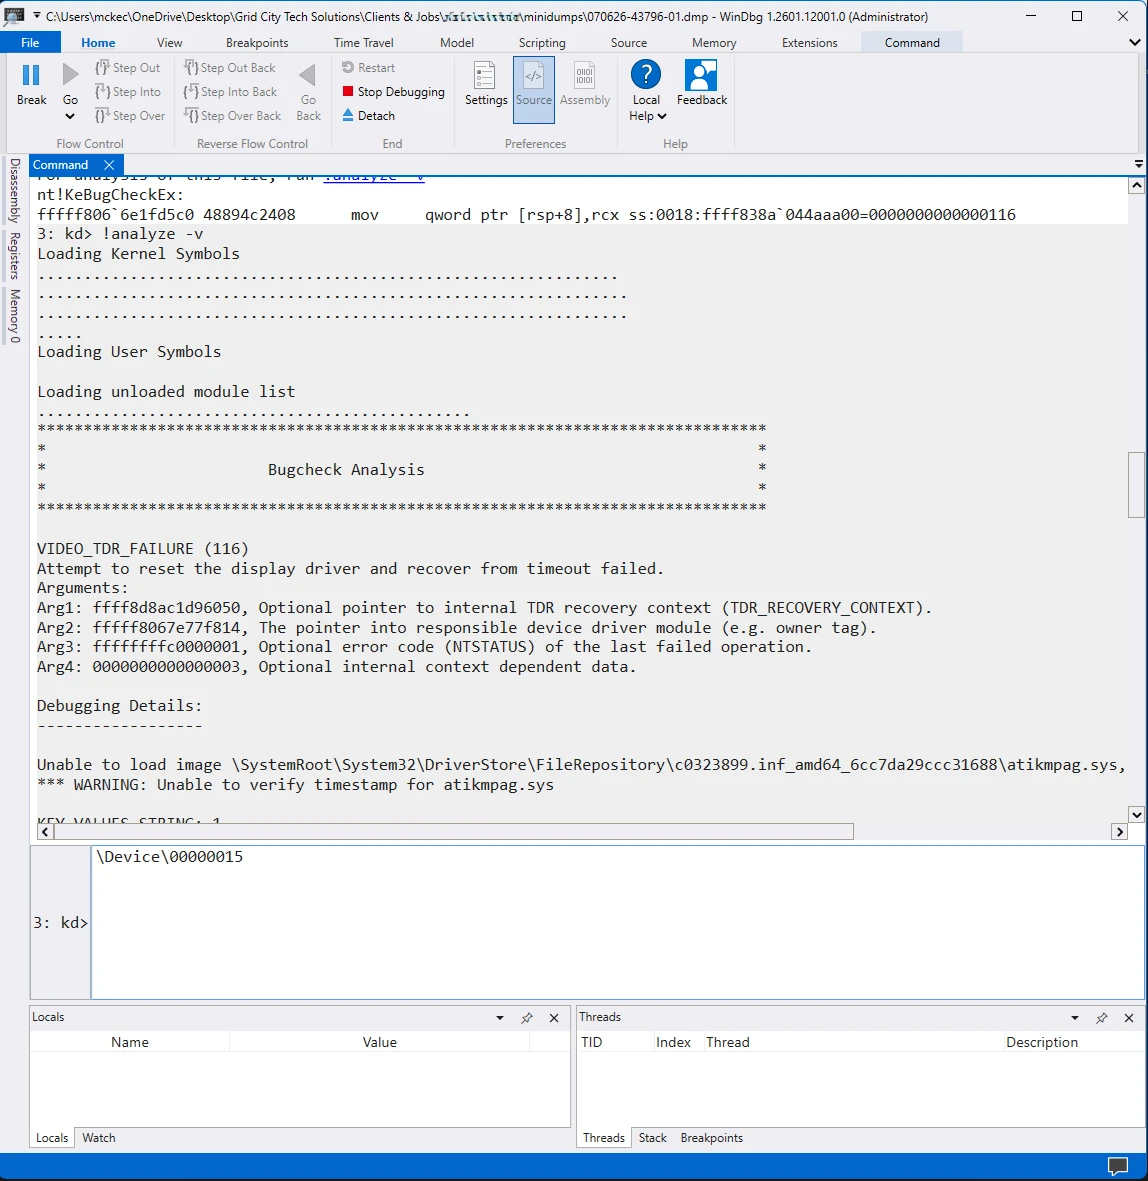
!analyze -v opens with the bugcheck banner — this dump is
a VIDEO_TDR_FAILURE (116), with each argument explained.
What to look for in WinDbg
You do not need to understand every hexadecimal address on the screen. Start with:
- BugCheck / stop code: The type of crash, such as
SYSTEM_SERVICE_EXCEPTION,MEMORY_MANAGEMENT, orDRIVER_POWER_STATE_FAILURE. - Arguments: Extra values whose meaning depends on that specific bug check.
- PROCESS_NAME: The process running when Windows crashed.
- MODULE_NAME / IMAGE_NAME: The module or driver present in the failing path.
- STACK_TEXT: The chain of function calls leading to the crash.
- FAILURE_BUCKET_ID: Microsoft's classification of that failure pattern.
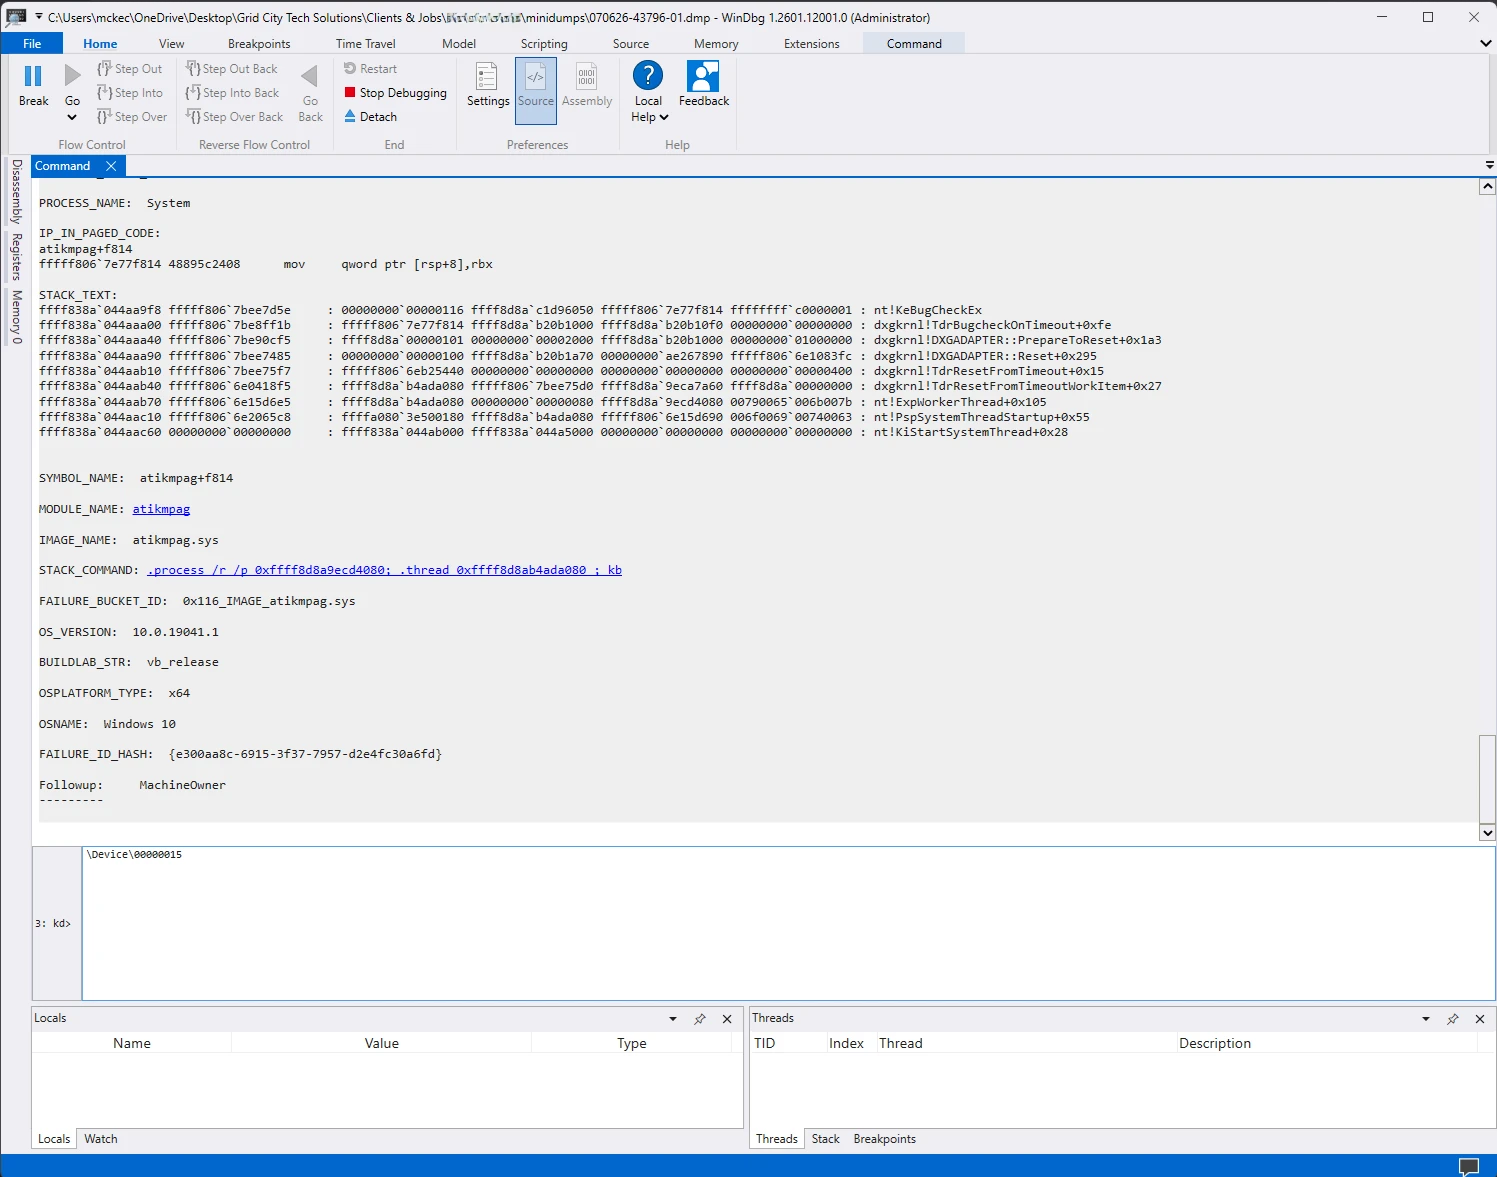
atikmpag.sys — an AMD display driver), and the
FAILURE_BUCKET_ID that classifies the crash.
If the dump names ntoskrnl.exe, that does not mean "the
Windows kernel is broken." The kernel is involved in every kernel crash.
Likewise, a graphics component may be where the system finally fell over,
while
a
completely different driver corrupted memory ten seconds earlier.
One dump gives you a lead. Several dumps showing the same third-party driver, same stop code, and same section of the stack give you a pattern. The pattern is what you act on.
If the Minidump folder is empty
Press Windows key + R, enter sysdm.cpl, and
then go to:
Advanced → Startup and Recovery → Settings
Under Write debugging information, select Small memory dump (256 KB) and confirm the directory is:
%SystemRoot%\MinidumpLeave the Windows page file enabled—System managed is normally fine—and restart the PC.
Even with that configured correctly, an instant power loss or hard freeze may produce no dump. Windows cannot save a crash report if it loses power or locks up before the dump writer can do its job. The absence of a dump is evidence too.
Step 4 — Use Task Manager and Resource Monitor for freezes and slowdowns
Event Viewer and Reliability Monitor tell you what Windows recorded. Resource Monitor shows what the computer is doing right now.
That makes it most useful when the PC slows down, stutters, or starts freezing but remains responsive long enough for you to inspect it. If the problem is repeatable, open these tools before reproducing it.
Start with Task Manager
Press Ctrl + Shift + Esc.
On the Processes page, sort by:
- CPU (central processing unit)
- Memory
- Disk
- Network
- GPU, if the problem is graphics-related
Then open Performance to see which resource is staying saturated. Task Manager is the fast overview. Resource Monitor is where you drill into the details.
Open Resource Monitor
Press Windows key + R, type resmon, and press
Enter.
Resource Monitor has five tabs: Overview, CPU, Memory, Disk, and Network.
Overview tab
Overview combines the four main resource categories. The best feature is the checkbox next to each process. Select a process, and the other sections filter down to activity associated with that process.
For example, select a browser process and you can see its CPU usage, memory activity, disk access, and network traffic without digging through every other process on the machine.
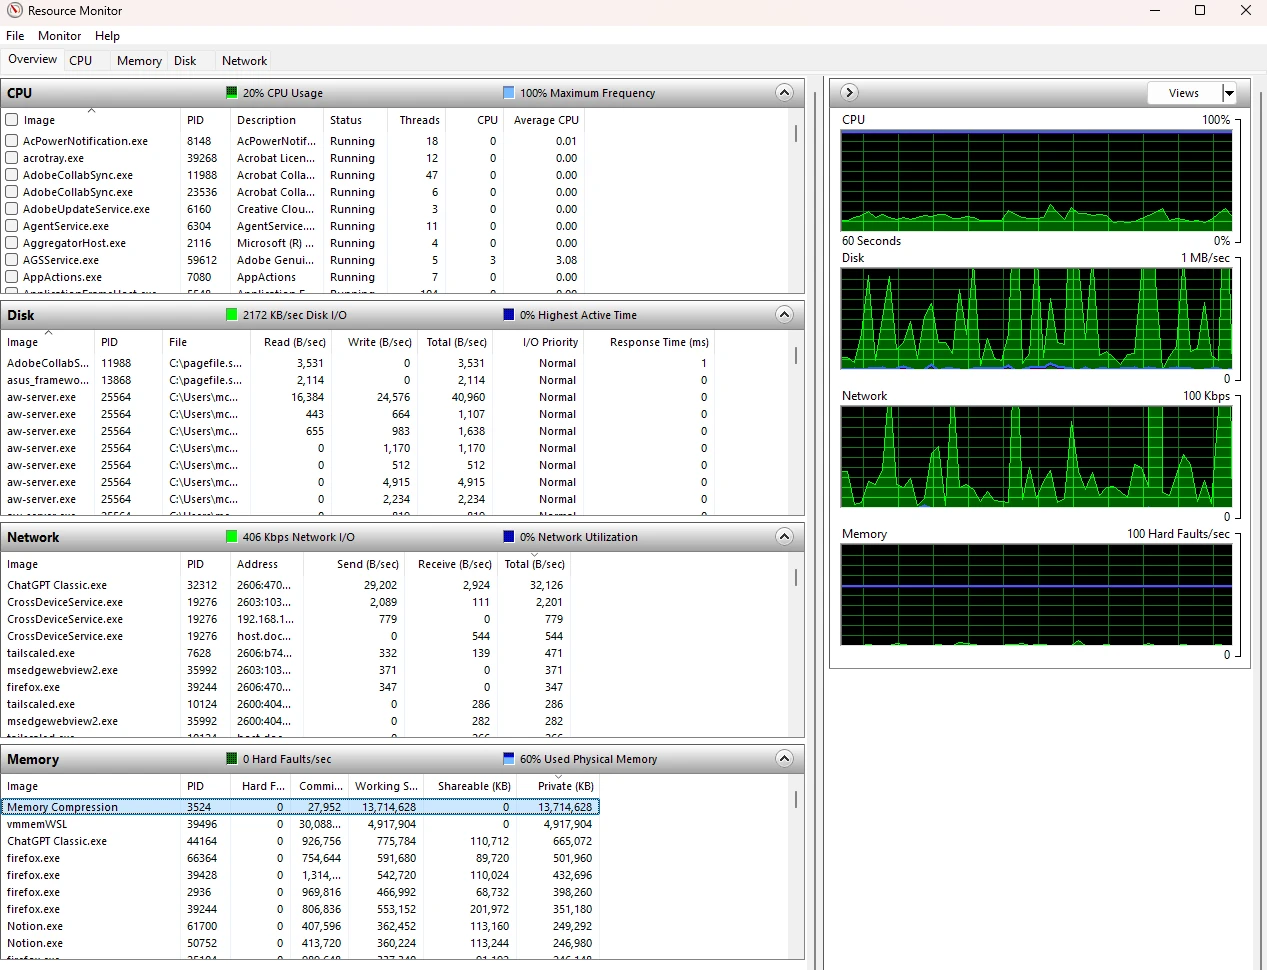
PID means Process Identifier. It is the unique number Windows assigns to that running process. Two processes may have the same name, but they will not have the same PID at the same time.
CPU tab
The CPU tab tells you which processes and services are consuming processor time.
Important fields:
| Terms & Labels | Definitions & Explanations |
|---|---|
| CPU | Current processor usage by that process. |
| Average CPU | Sustained usage over the recent sampling window. This is often more useful than one quick spike. |
| Threads | Separate execution paths running inside a process. One process can contain many threads. |
| Services | Windows services connected to the selected process. This is especially useful when a generic svchost.exe process is busy. |
| Associated Handles | Files, registry keys, events, and other operating-system objects opened by the process. |
| Associated Modules | Dynamic-link libraries (DLLs) and other modules loaded into the process. |
If one process is "Not Responding," right-click it and select Analyze Wait Chain. This can show whether it is waiting on another process or thread. Be careful about ending anything you do not recognize, especially Windows system processes.
The individual CPU graphs represent logical processors. If one graph is pinned while the total CPU percentage looks fairly low, you may have a single-threaded workload saturating one logical processor.
Maximum Frequency shows the CPU's current operating frequency as a percentage of its reported normal frequency. Power-saving behavior can pull it below 100%, and boost behavior may push it above 100% on some systems. A low reading at idle is normal. A consistently low reading under heavy load can support a throttling theory, but it does not prove one by itself.
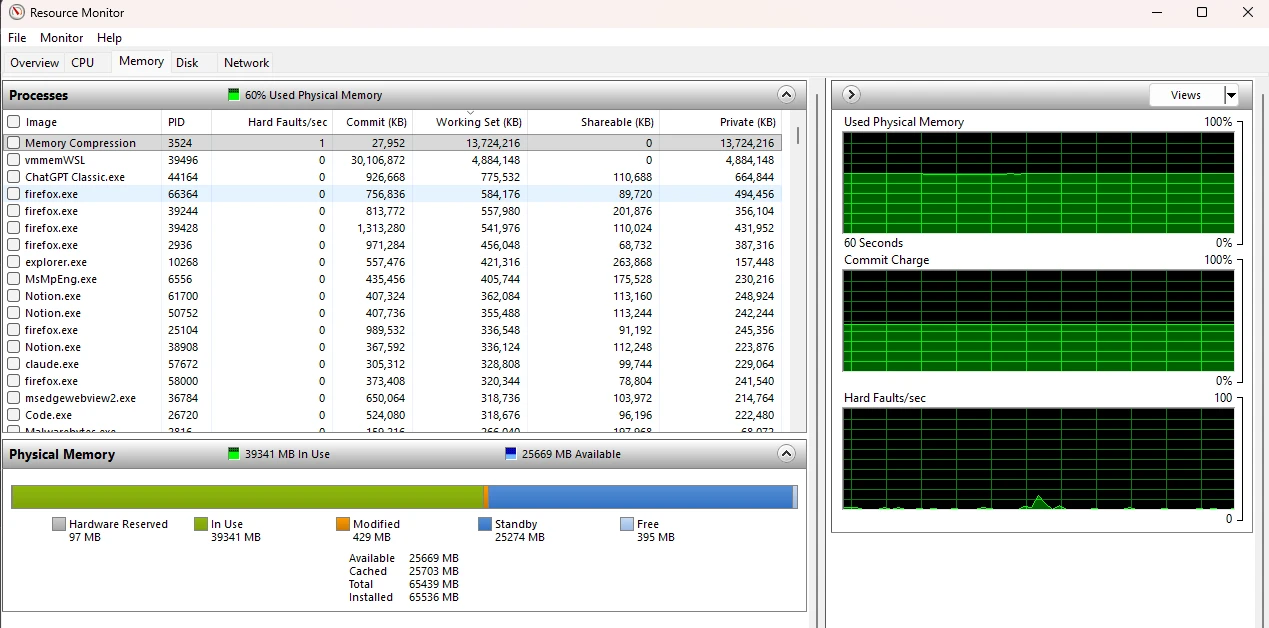
Memory tab
The Memory tab is full of terms that sound far more alarming than they actually are. RAM means random-access memory.
| Terms & Labels | Definitions & Explanations |
|---|---|
| Commit | Virtual memory Windows has committed to the process. It must be backed by RAM or the page file, but it is not the same thing as current RAM use. |
| Working Set | Physical RAM currently assigned to the process. |
| Shareable | The part of the working set that can be shared with other processes. |
| Private | The part of the working set that belongs only to that process. |
| Hard Faults/sec | How often requested memory pages must be retrieved from disk because they are not currently resident in RAM. |
The name hard fault is terrible. A hard fault does not mean your RAM is faulty. Some hard faults are normal, especially while opening a program or loading data for the first time.
It becomes interesting when hard faults remain high at the same time that:
- Available memory is very low.
- Disk activity is heavy.
- Programs are visibly stalling.
- The same process is generating most of the faults.
That combination suggests memory pressure and paging. A few brief spikes do not.
The physical-memory bar breaks RAM into:
| Terms & Labels | Definitions & Explanations |
|---|---|
| Hardware Reserved | Memory set aside for hardware and unavailable to Windows. |
| In Use | Memory actively used by Windows, applications, and drivers. |
| Modified | Memory containing changed data that must be written before Windows can repurpose it. |
| Standby | Cached data that can be reclaimed quickly when another process needs the RAM. |
| Free | Completely unused RAM. |
Standby memory is not wasted memory. Windows deliberately uses spare RAM as a cache because cached data is faster than reading it from storage again.
If a process's Commit or Private memory climbs for hours and does not fall after the workload ends, you may be looking at a memory leak. Watch the trend. One high reading is a load; a line that only climbs and never gives memory back is a leak.
Disk tab
The Disk tab tells you which process is reading or writing which file.
Important fields:
| Terms & Labels | Definitions & Explanations |
|---|---|
| Image / PID | The process responsible for the disk activity. |
| File | The exact file being accessed. |
| Read (B/sec) | Bytes read per second. |
| Write (B/sec) | Bytes written per second. |
| Total (B/sec) | Combined read and write rate. |
| Response Time (ms) | How long the storage device is taking to complete requests. |
| Disk Queue Length | Requests waiting for the drive. |
A disk can show 100% active time while moving surprisingly little data. This commonly happens when a slower drive is buried under lots of tiny random reads and writes, or when Windows is paging heavily because memory is tight.
There is no universal "queue length above X means the drive is bad" rule that works across hard drives, Serial ATA (SATA) solid-state drives (SSDs), and modern Non-Volatile Memory Express (NVMe) SSDs. Look for sustained high active time, rising response time, a persistent queue, and visible system lag occurring together.
The File column is incredibly useful. It can reveal that the activity is Windows Update, antivirus scanning, search indexing, cloud synchronization, a game building a shader cache, or the page file—not some mysterious dying drive.
Also check how much free storage remains. Windows needs room for temporary files, updates, the page file, and crash dumps. A nearly full drive can cause serious slowdowns and can prevent Windows from writing the very dump file you need.
Network tab
The Network tab is less likely to explain a total PC crash, but it is useful for application hangs, slow cloud software, failed downloads, and background synchronization.
It shows:
| Terms & Labels | Definitions & Explanations |
|---|---|
| Processes with Network Activity | Which programs are sending or receiving data. |
| Network Activity | The remote address and send, receive, and total transfer rates. |
| TCP Connections | Local and remote addresses, ports, packet loss, and latency for Transmission Control Protocol (TCP) connections. |
| Listening Ports | Programs waiting for inbound network connections and the applicable firewall status. |
An unfamiliar remote Internet Protocol (IP) address is not automatic proof of malware. Websites and legitimate applications connect to cloud servers, advertising networks, content-delivery networks, and update services constantly. First identify the process, then the connection, then decide whether it makes sense.
Resource Monitor does not show everything. It has no GPU tab and is not a proper temperature or power-monitoring tool. Use Task Manager for a quick GPU view. If your evidence points toward overheating, power delivery, or hardware instability, you will need the computer manufacturer's diagnostics or a reputable hardware-monitoring tool.
Step 5 — Run a targeted built-in test
At this point, your evidence should point you toward a category. Now you test that theory.
If memory is the suspect
Press Windows key + R, enter:
mdsched.exeChoose Restart now and check for problems. Save your work first because the PC will reboot.
When Windows Memory Diagnostic starts, you can press F1 and change the test mix from Standard to Extended for a longer test. After Windows starts again, check Event Viewer for the source Microsoft-Windows-MemoryDiagnostics-Results if the notification disappears too quickly.
A reported memory error matters. A clean result is reassuring, but it does not completely rule out an intermittent RAM problem, an unstable memory overclock, or an issue that only appears under a particular temperature or load.
If Windows system-file corruption is the suspect
Open Command Prompt as Administrator and run these in this order:
DISM.exe /Online /Cleanup-Image /RestoreHealth
sfc /scannow
Deployment Image Servicing and Management (DISM) repairs the Windows component store that System File Checker (SFC) uses as its repair source. SFC then checks protected Windows system files and replaces damaged copies when it can.
These are repair tools, not universal crash detectors. If SFC says it
repaired a file, record that result and see whether the crash returns. Do
not treat sfc /scannow as holy water.
If storage or file-system corruption is the suspect
Open Command Prompt as Administrator and run:
chkdsk C: /scanThis performs an online scan of the C: volume. CHKDSK checks the file system; it is not a complete health test for the physical drive.
If Windows reports file-system errors that require repair, back up
important data before moving on to a repair such as
chkdsk C: /f. When a drive may be failing, protecting the data
comes before beating the drive with increasingly aggressive tests.
If a driver or background program is the suspect
Check:
- Device Manager for devices marked with an exclamation point.
- Settings → Windows Update → Update history for changes immediately before the failures began.
- The hardware manufacturer's site for the correct driver.
- Whether rolling back the one recently changed driver stops the crash.
Avoid generic "driver updater" utilities. They often install whatever package has a vaguely matching hardware ID, which is a fantastic way to turn one problem into three.
If the crash disappears in Safe Mode, that makes a third-party driver, service, startup program, or setting more likely. It does not identify which one.
For a cleaner isolation test, use a clean boot:
- Search for and open
msconfig. - Open the Services tab.
- Select Hide all Microsoft services first.
- Select Disable all.
- Open Task Manager from the Startup tab and disable the enabled startup items.
- Restart and try to reproduce the problem.
Keep a record of what you disabled so you can restore it. If the problem disappears, re-enable items in groups until it returns. That is slower than guessing, but it produces an actual answer.
The four practical crash flows
PC Crash & Slowdown Diagnostic These same flows in tool form — answer a few questions about your symptoms and it points you to the most likely cause before you replace any hardware.If you got a BSOD or stop code
- Record the stop code and exact time.
- Open Reliability Monitor and find the matching failure.
- Check Event Viewer for Event 1001 and the dump path.
- Open the dump in WinDbg and run
!analyze -v. - Compare multiple dumps before blaming a module.
- Run the targeted test suggested by the evidence.
If the PC instantly shut off or rebooted
- Record the exact time and what the PC was doing.
- Confirm Event 41 and 6008 in Event Viewer.
- Look for WHEA, storage, display, or driver events immediately before them.
- Check whether Event 1001 or a dump exists.
- If there is no bug check or dump, investigate power, heat, overclocking or undervolting, the charger or power supply, recently added hardware, and physical connections.
An instant shutdown with no dump pushes power and hardware higher on the list, especially if it happens under load, but it still does not prove the power supply is guilty.
If the PC completely freezes
- Open Task Manager and Resource Monitor before reproducing the issue.
- Watch CPU, memory, disk, GPU, and the process that becomes unresponsive.
- Use Analyze Wait Chain if one application hangs.
- After restarting, check Reliability Monitor and both the System and Application logs at the freeze time.
- If the freeze leaves no useful log or dump, move toward memory, storage, temperature, driver, and clean-boot testing.
If only one application crashes
- Check Reliability Monitor for the application failure.
- Open Event Viewer → Windows Logs → Application.
- Look near the crash time for Application Error Event 1000, Application Hang Event 1002, or a Windows Error Reporting event.
- Record the faulting application, module, exception code, and application version.
- Repair, update, roll back, or reinstall that application based on the evidence.
Again, match both the Event ID and Source. The same event number can mean something different under another provider.
Keep a simple crash log
Intermittent crashes are difficult because your memory of them gets fuzzy. Use a plain text file and record:
Date and time:
What I was doing:
Crash type:
Stop code:
Recent changes:
Reliability Monitor result:
Event Viewer result:
Dump file:
WinDbg result:
Resource Monitor observation:
Test performed:
Result:
After three incidents, the pattern may become obvious: every crash happens while waking from sleep, every dump names the same storage driver, or memory usage climbs for 30 hours before the machine falls over.
That is how you move from "my computer randomly crashes" to a useful diagnosis.
What not to do
- Do not assume Kernel-Power 41 means you need a new power supply.
- Do not assume the first module named by WinDbg caused the crash.
- Do not install every driver update available at once.
- Do not run random registry cleaners or generic driver-updater programs.
- Do not call Resource Monitor hard faults "bad RAM."
- Do not delete your dump files before copying or analyzing them.
- Do not make five corrective changes and then claim whichever one you liked best fixed it.
You may also see people recommend Driver Verifier. It is a legitimate built-in Windows tool, but it deliberately stresses drivers and can cause additional BSODs or leave an already unstable PC difficult to boot. It is not part of this first-pass workflow. Use it only when you understand how to disable it from Windows Recovery Environment if the computer will no longer start normally.
When to stop diagnosing it yourself
Stop and protect your data first if:
- The storage drive is disappearing, making unusual noises, or reporting repeated input/output (I/O) errors.
- You smell burning, see smoke, or find a swollen laptop battery.
- The PC repeatedly loses power or overheats.
- The crashes are getting more frequent.
- Windows no longer boots reliably.
- Important files are not backed up.
Diagnostics are useful. Recovering the evidence is not worth turning a failing drive into a dead drive or an electrical problem into a fire.
- Start by identifying the exact crash type, timestamp, trigger, and stop code. "My PC crashed" is only a symptom.
- Use Event Viewer and Reliability Monitor to build the timeline, but remember that Kernel-Power 41 confirms an unclean shutdown—it does not identify the cause.
- Use Task Manager and Resource Monitor for live slowdowns and freezes; use WinDbg and the crash dump for a real BSOD.
- Test one evidence-based theory at a time, record the result, and look for a repeatable pattern before declaring the problem fixed.
Frequently asked questions
Does Kernel-Power Event 41 mean my power supply is failing?
No. Event 41 only records that Windows restarted without completing a clean shutdown. A power outage, a failing power supply, overheating, a BSOD, a hard freeze, or someone holding the power button all produce the same event. Treat it as evidence of the aftermath, not the root cause.
Do hard faults in Resource Monitor mean my RAM is bad?
No. A hard fault means a requested memory page had to be retrieved from disk because it was not resident in RAM. Some hard faults are normal. Sustained high hard faults combined with very low available memory, heavy disk activity, and visible stalling suggest memory pressure and paging — not defective RAM.
Why is my Minidump folder empty after a BSOD?
Dump writing may not be configured, or the failure prevented Windows from writing one. Set Write debugging information to Small memory dump under Startup and Recovery and leave the page file enabled. An instant power loss or hard freeze can still leave no dump at all — the absence of a dump is evidence too.
Is one WinDbg result enough to identify the faulty driver?
Treat the module WinDbg names as a suspect, not a conviction. The kernel is involved in every kernel crash, and the module that finally fell over is not always the one that caused the damage. Several dumps naming the same third-party driver, same stop code, and same section of the stack form a pattern you can act on.
References
- Kernel-Power Event ID 41 and related shutdown events
- Troubleshoot Windows unexpected restarts and stop-code errors
- Read small memory dump files
- Install WinDbg
- Analyze a kernel-mode dump with WinDbg
- Use DISM and System File Checker
- Perform a clean boot in Windows
- CHKDSK command reference